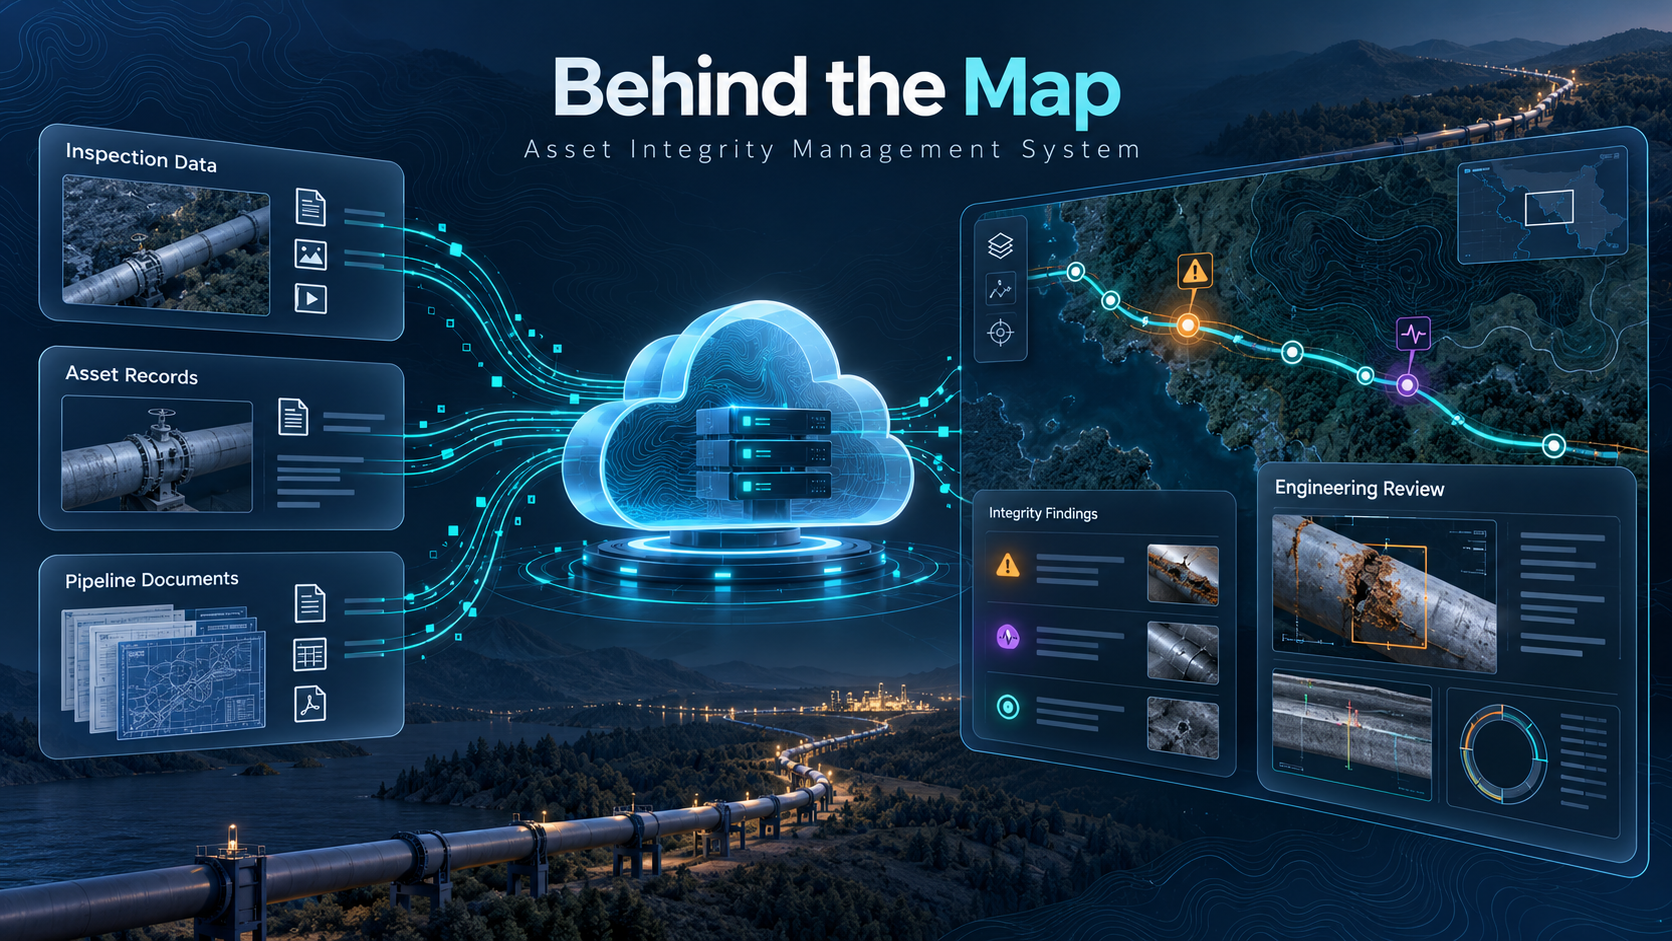
An integrity engineer is reviewing an inspection finding that appears straightforward: a defect, a kilometre position and a severity value. The difficult questions begin afterwards. Which pipeline segment does the finding belong to? Is the location recorded using the same reference system as the asset register? Are there related documents, previous inspections or repair records? Does the finding appear in the same place on the map as it does in the source file?
For an Asset Integrity Management System, a map is only useful when the information behind it is reliable and connected.
The map is the visible part of a larger system
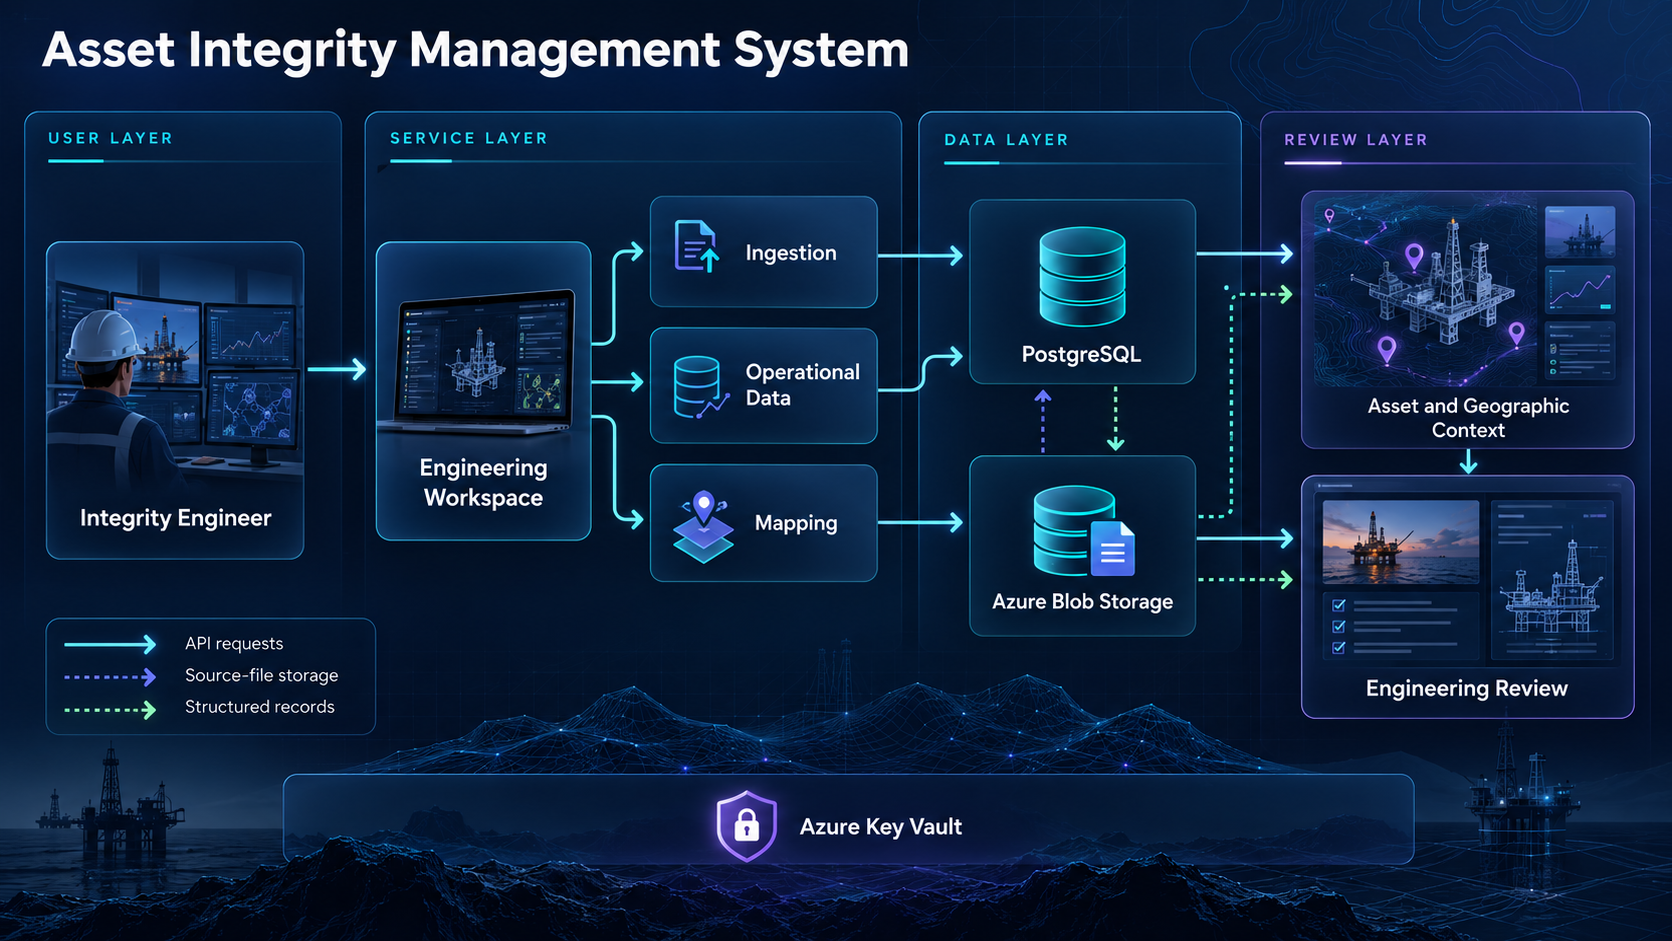
A modern SaaS platform for the energy industry must connect structured records, source files, asset identifiers and geographic context while preserving enough lineage for engineers to understand where each result came from.
An Angular frontend provides the workspace. Python and FastAPI services expose APIs for ingestion, operational data access and mapping workflows. PostgreSQL stores structured records and relationships. Azure Blob Storage retains uploaded documents and source files. Azure Key Vault protects configuration, while containerised delivery supports deployment across environments.
The mapping experience sits at the end of this chain. Files must be received, fields interpreted, records persisted and identifiers connected to assets before a map can provide useful context.

From asset record to map feature
Consider an inspection record containing a segment identifier, kilometre position, feature type and measured severity. The platform first needs to determine whether the record can be interpreted consistently. Different contractors may use different column names, units, date formats or asset references.
Once the data has been interpreted, the ingestion service stores the original source and creates structured records for application use. Mapping services use identifiers and location information to associate the record with an asset or geographic feature. The engineer can then review the finding alongside the pipeline route, nearby features and related information.
This relationship also works in the opposite direction. Selecting an asset on the map may reveal its inspection history, supporting documents or associated integrity tasks. The map is both a visualisation and a navigation layer into the wider data model.
Why service boundaries matter
An Oil and Gas platform handles different kinds of work at different speeds. File ingestion may involve large uploads and background processing. Operational queries need efficient structured records. Mapping workflows need asset and geographic data in a form that supports interactive review.
Separating these responsibilities makes the system easier to reason about, while shared identifiers, compatible database structures and stable API behaviour keep the user journey continuous. The architecture therefore requires consistent contracts and careful handling of lineage.
Traceability is part of the engineering experience
A map can look authoritative even when the data behind it is incomplete. An engineer should be able to understand the relationship between a displayed feature, the structured record behind it and the source material from which that record was produced. That requires preserving identifiers, metadata and processing context.
This principle also creates a foundation for analysis-ready datasets, advanced reporting and carefully governed AI-assisted retrieval. Those capabilities should remain connected to source evidence and subject to engineering review.
What this architecture enables
The data-lineage diagram below shows the platform’s path from source material to engineering action, connecting the original file to interpreted fields, structured records, asset relationships and map-based review.
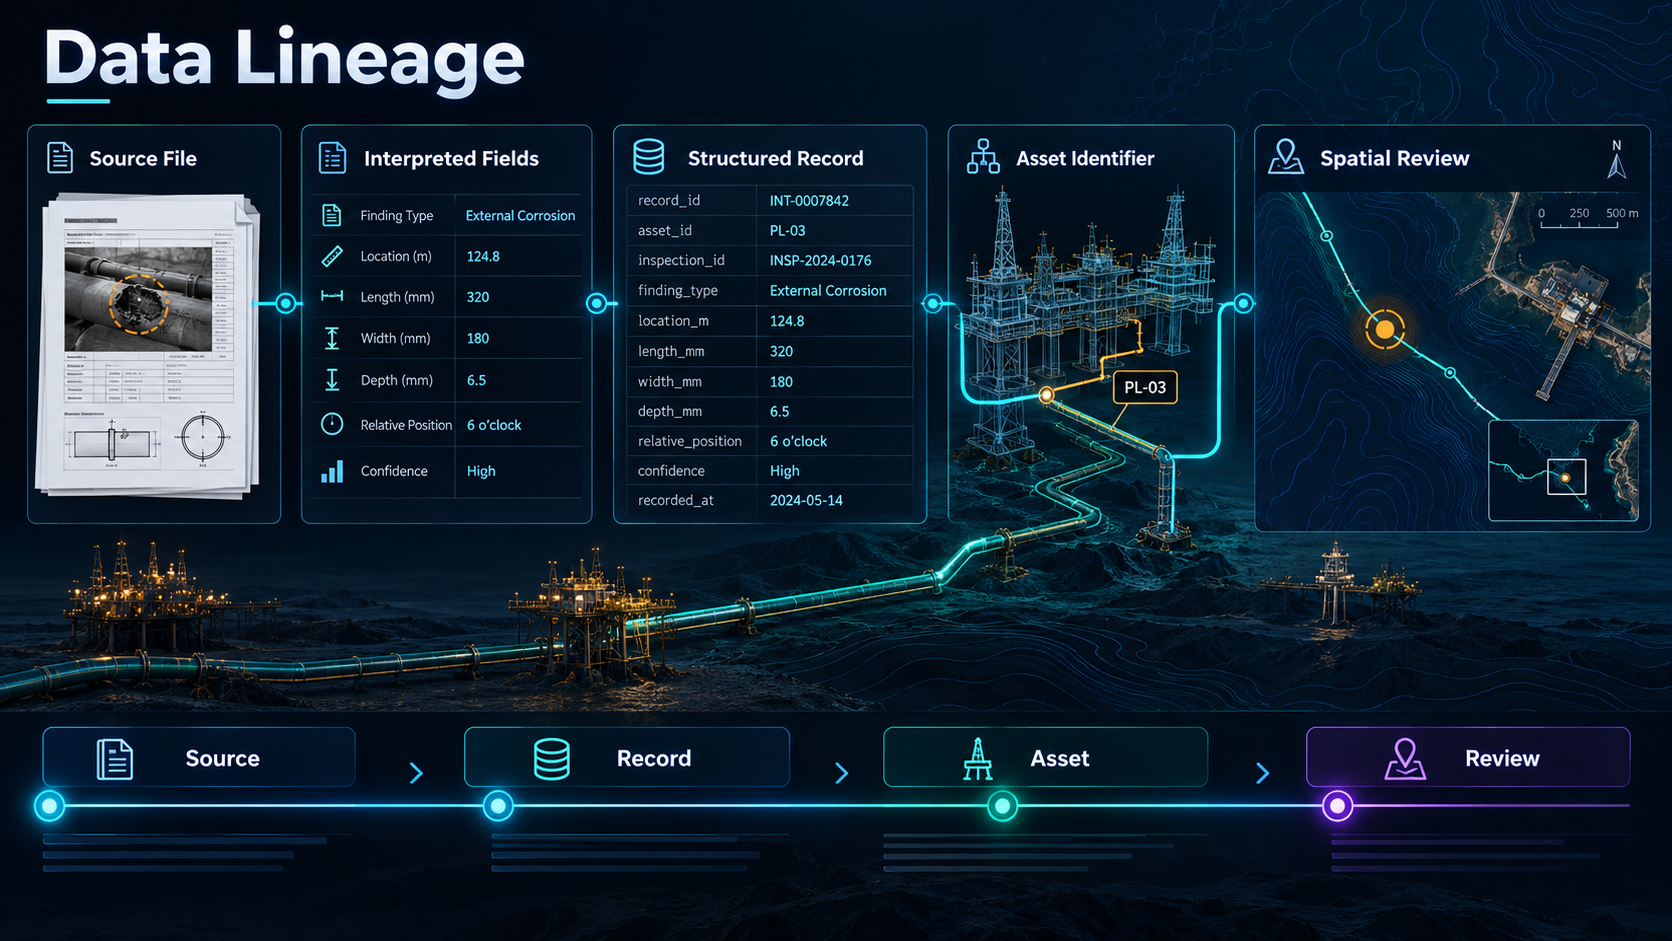
For an Asset Integrity Management System, that path is the core product value. It transforms fragmented inspection information into a connected view of pipeline assets and their condition. The map is the feature users see first; the architecture behind it is what makes the map useful.